An attempt was made to detect changes in spectral signals due to prop scarring and restoration efforts.
Area of Interest
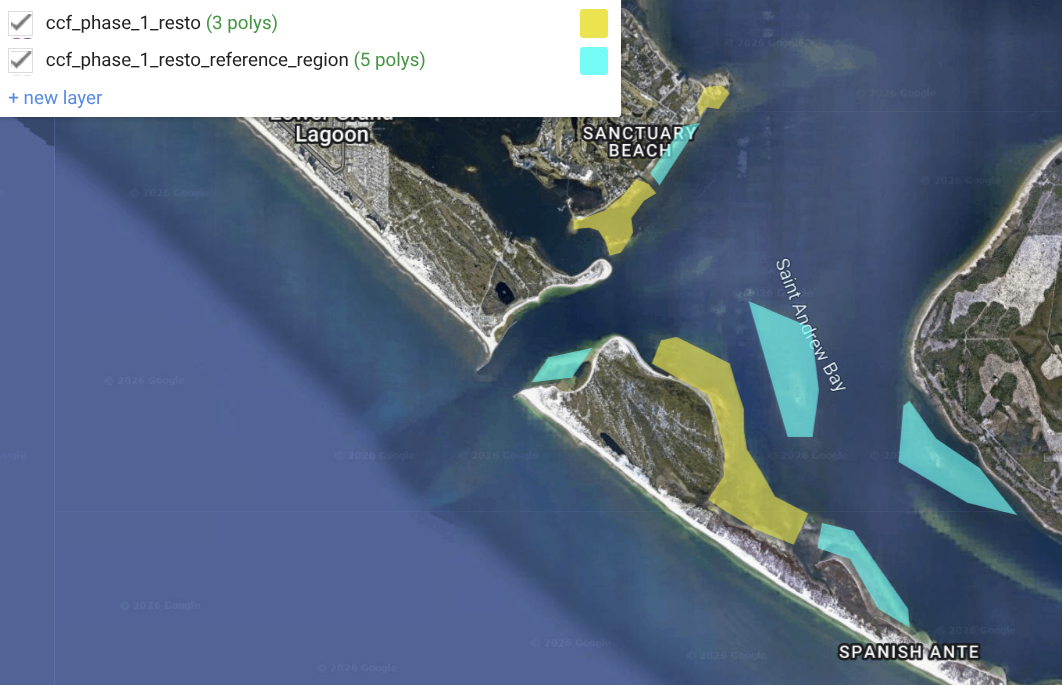
A polygon for the Area of Interest (AoI) were hand-drawn to approximate polygons identified in the “CCA24 Phase 1 Installation Map Package_Nov2025.pdf” document [ref email for Tylar only].
A “reference region” of nearby area with similar optical characteristics was drawn.
Imagery, PreProcessing, Time Series Extraction
Landsat-Harmonized Sentinel-2 imagery was sampled across these polygons using this GEE script.
CloudScore+ cloud filtering was applied. BandSum normalization was performed using the sum of all bands except for band 9.
The resulting time series data were uploaded to github/7yl4r/HabEvent/aoi-extractions.
Indices
Four spectral indices are calculated from the raw band values to target seagrass.
- WAVI:
(B8-B2)/(B8+B2) - inverse NDSVI (~NDSVI)
(B3-B2)/(B3+B2) - red_edge1/red
B5/B4 - Normalized Difference red_edge1-red
(B5-B4)/(B5+B4)
Reference Region Adjustment
The reference region is used as a baseline against which to compare the AoI. The region is intended to be very similar to the AoI, but without the restoration efforts applied. This adjusts for transient water clarity events and seasonal signals that affect the broader area.
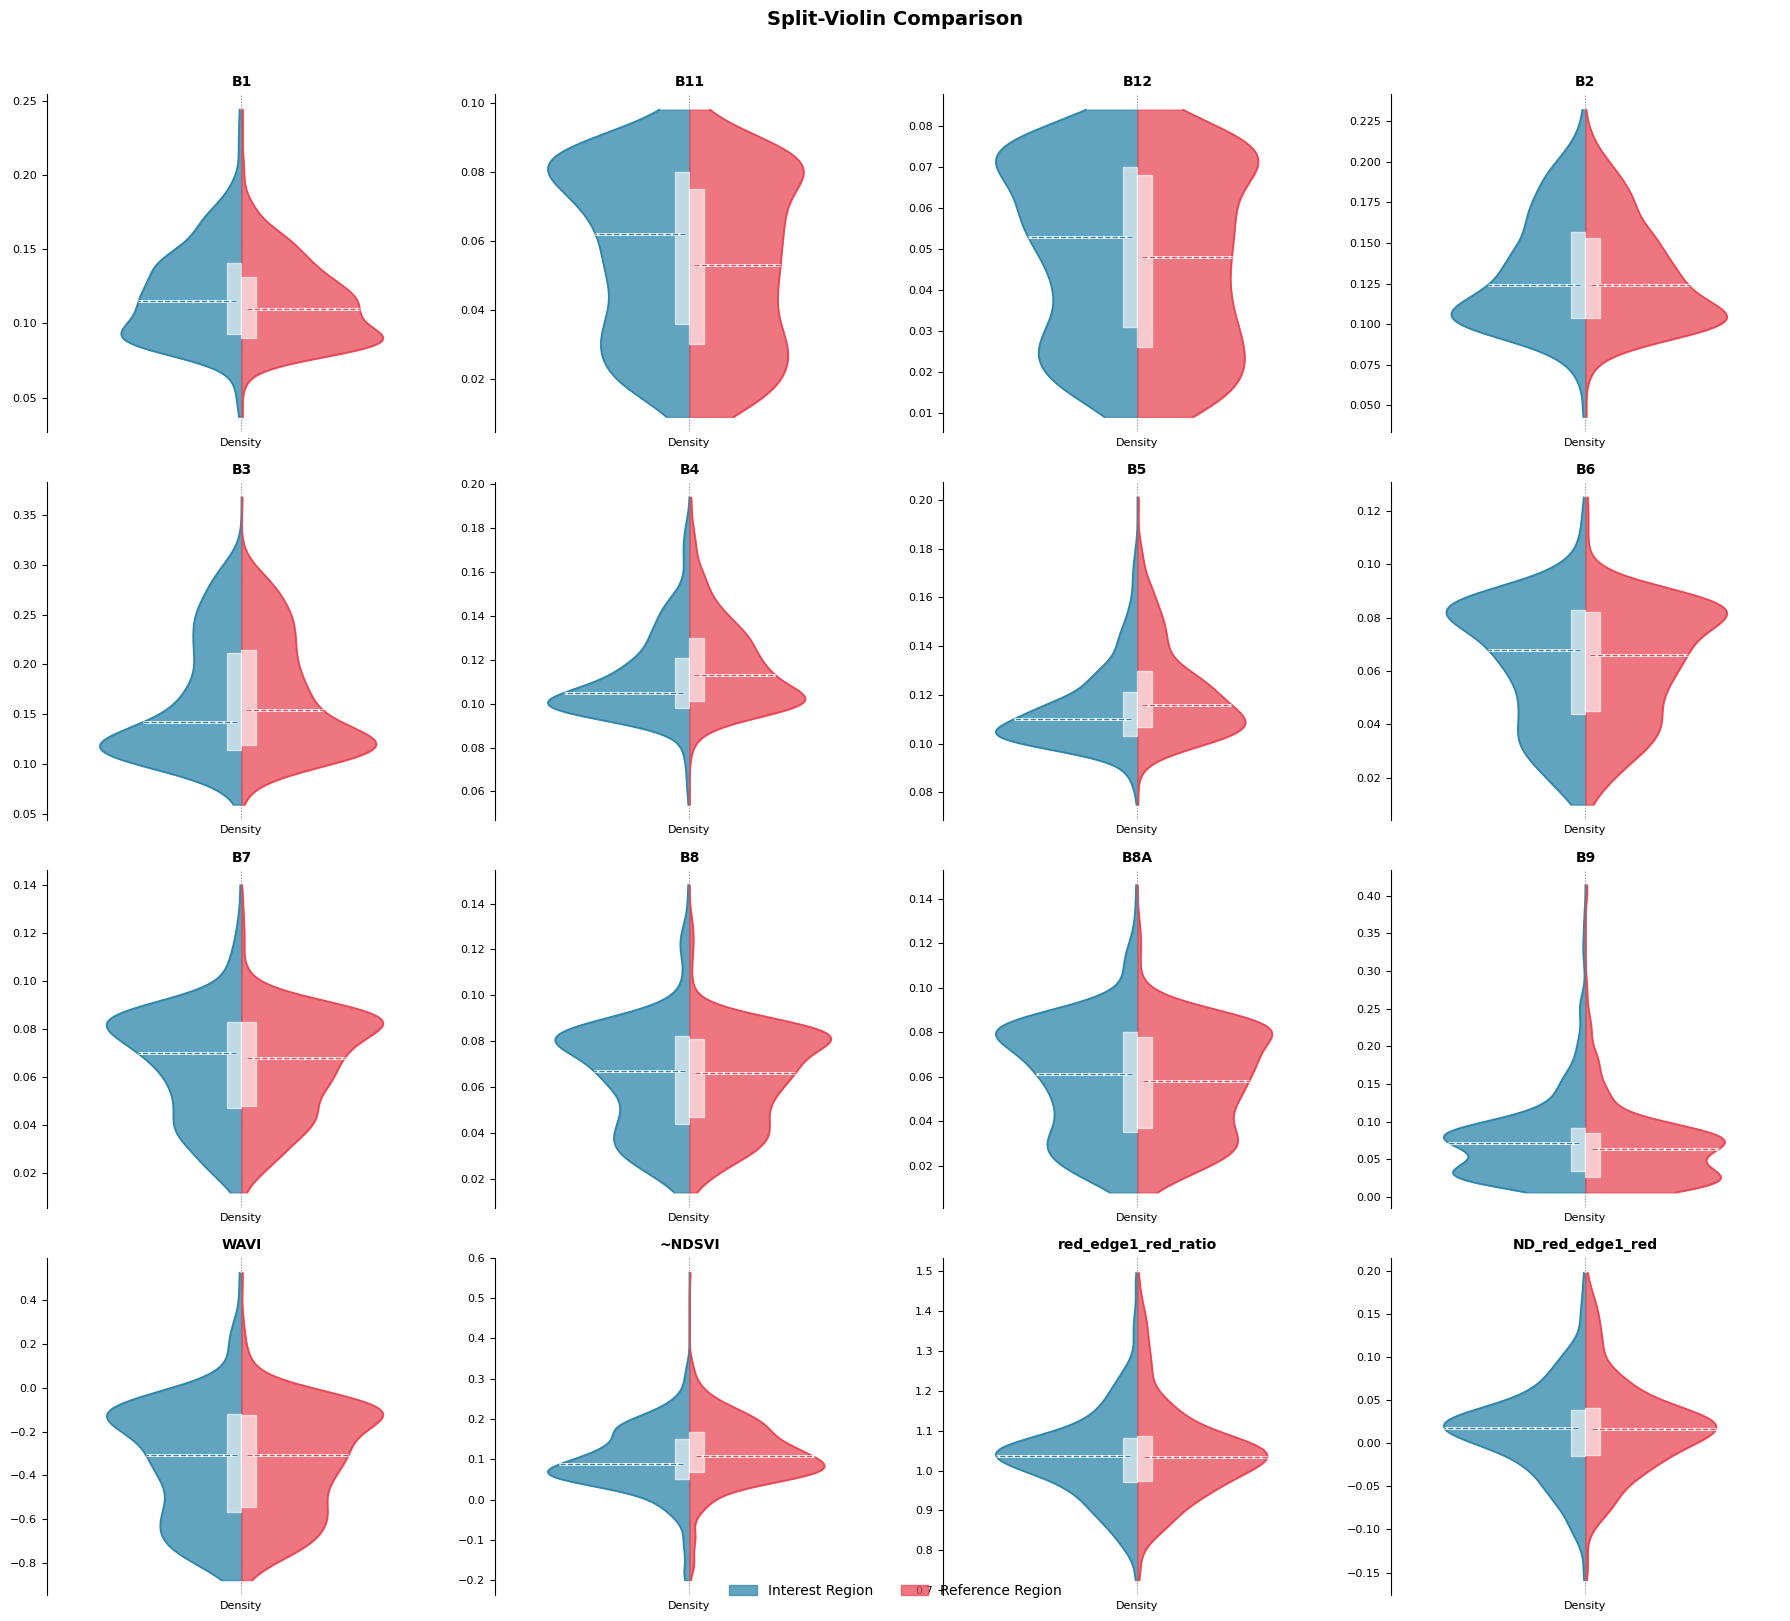
Values in the extracted time series have similar distributions across all bands and indices.
Seasonal Decomposition
A seasonal decomposition with an additive model was applied to separate the seasonal signal from long term trends and residuals using statsmodels’ seasonal_decompose.
The resulting differenced values are converted to z-scores for display on a common y-axis.
Results
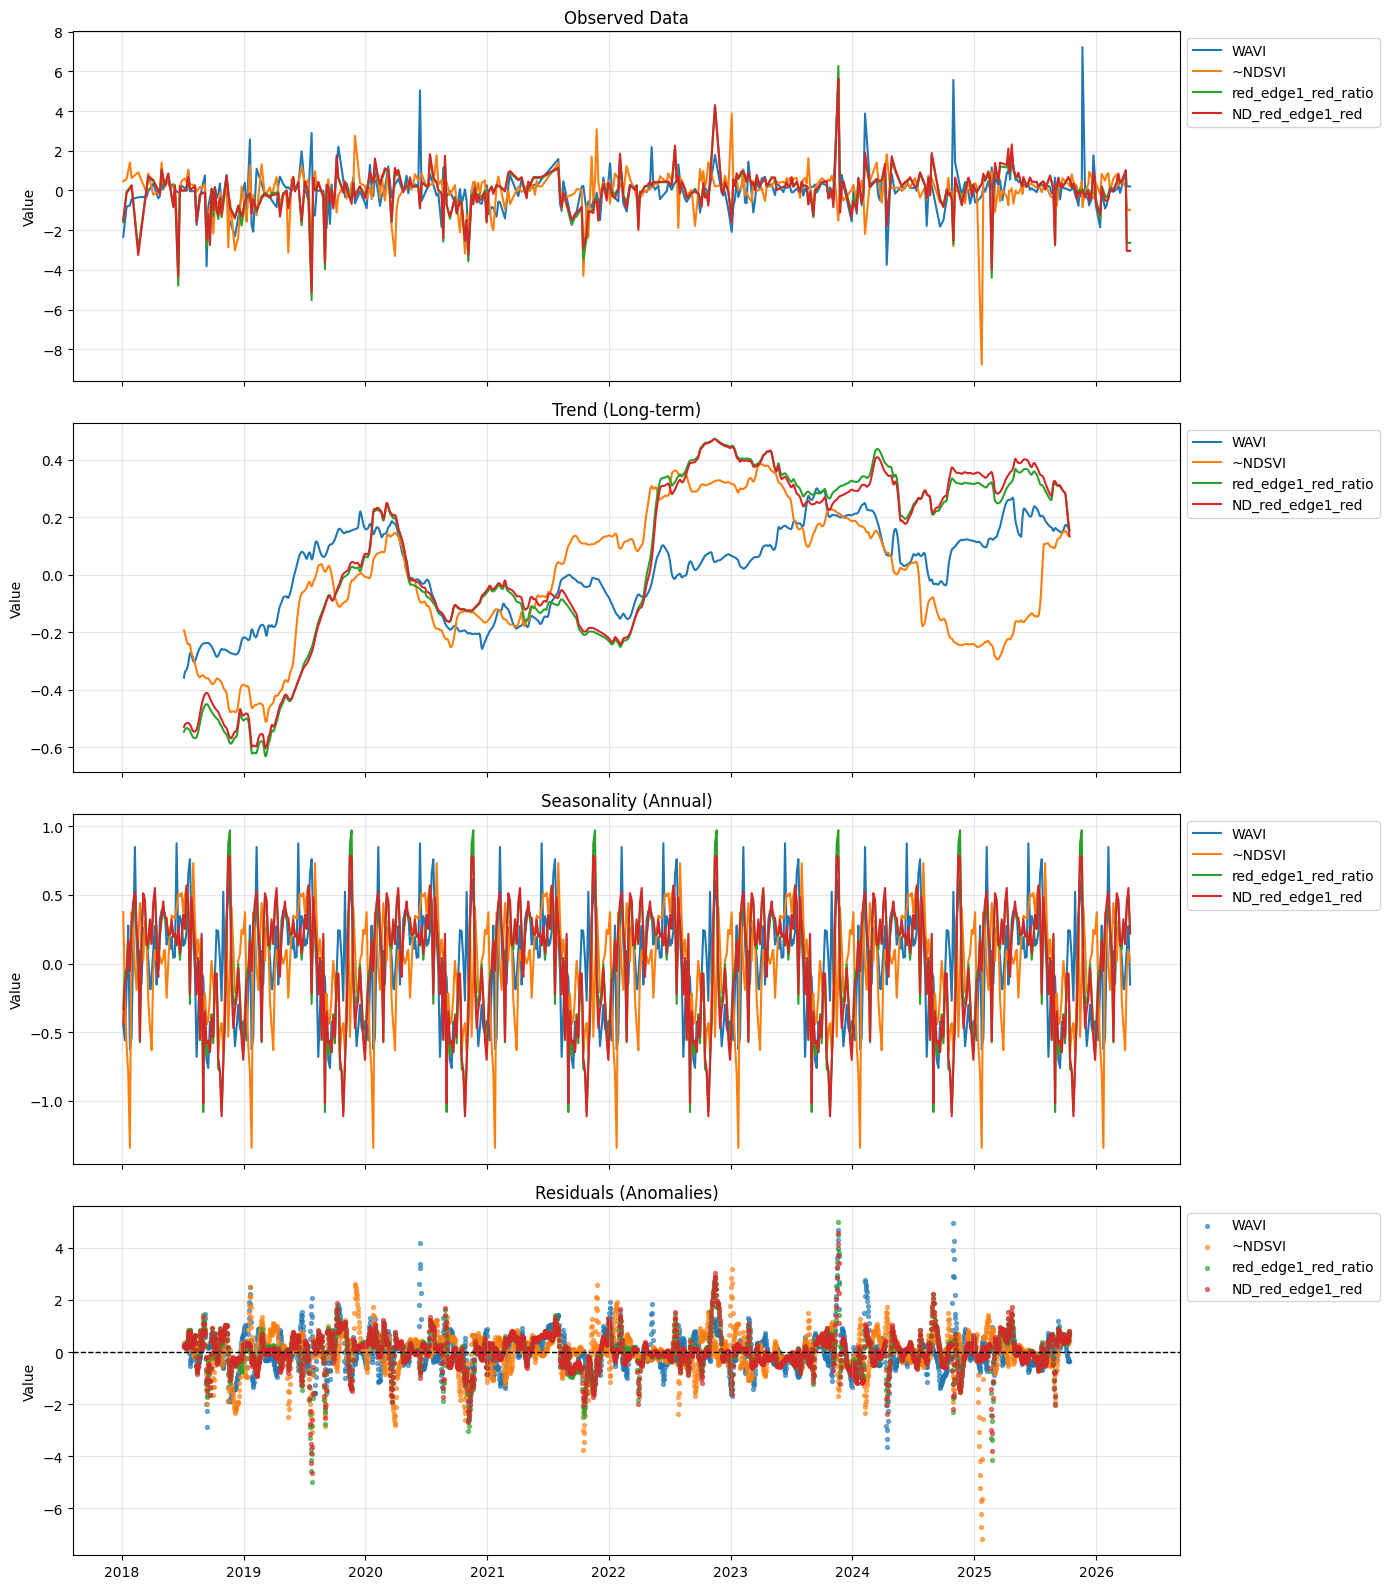
A sine-shaped seasonal signal is observed in each of the indices. Long-term trends for all indices follow each other closely at some times and diverge at others.